Member-only story
Financial Technical Analysis Crypto Narrative Chapter 7 Harmonic Pattern

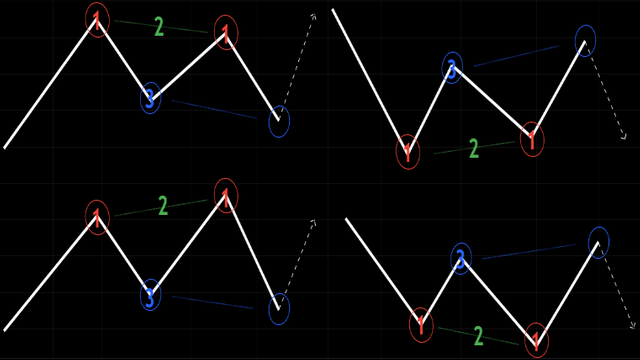
In Chapter 5, we draw lower and upper trend line to identify classic chart patterns but in this chapter we use Chapter 6 Fibonnaci Golden Ratios to measure harmonic chart patterns. Most harmonic patterns have 5 phases forming XABCD pattern. To quickly identify them is to find 2 mountains for bullish harmonic patterns and 2 wells for bearish harmonic patterns. The next thing to see is whether one of the mountains or wells is shorter than the other. Finally, the middle point is higher than the first and last point for bullish harmonic patterns and lower than the first and last point for bearish harmonic patterns. In short should look similar to an imperfect “M” letter for bullish harmonic patterns and imperfect “W” letter for bearish harmonic patterns.
The harmonic patterns are said to be inspired from music and wave theories of harmonic ratios. For example from José Rodríguez Alvira, Harmonic Series, an Octave have a ratio of 130 Hz / 65 Hz = 2. Harmonic patterns are defined by the measurements of Fibonacci Golden Ratios on the XABCD pattern.
